How to
1.How to search
A. Quick search
The quick search tool that users get gene information quickly through gene name on the home page.

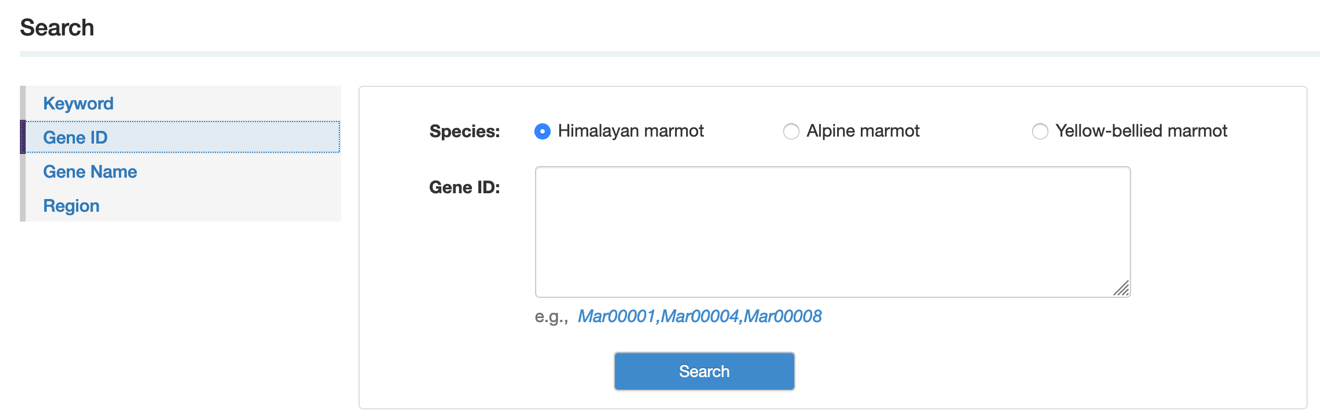
B. Gene information search
On the search page, we provided a “one-stop” retrieval system for viewing gene information by gene ID, gene name or gene locus.
Step 1: Select the species, then type the gene ID, gene name or gene locus
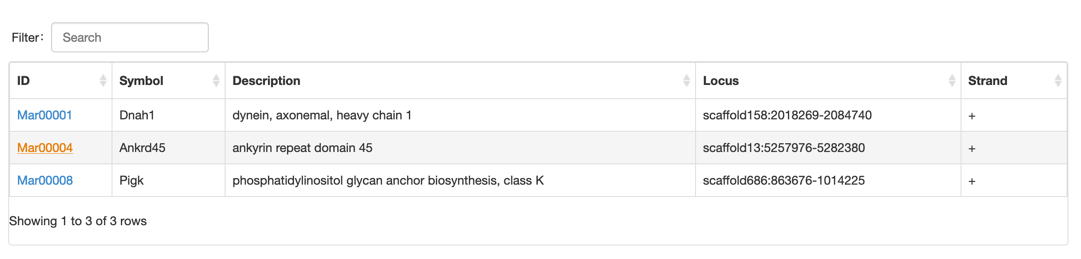
 Step 2: select the gene you want
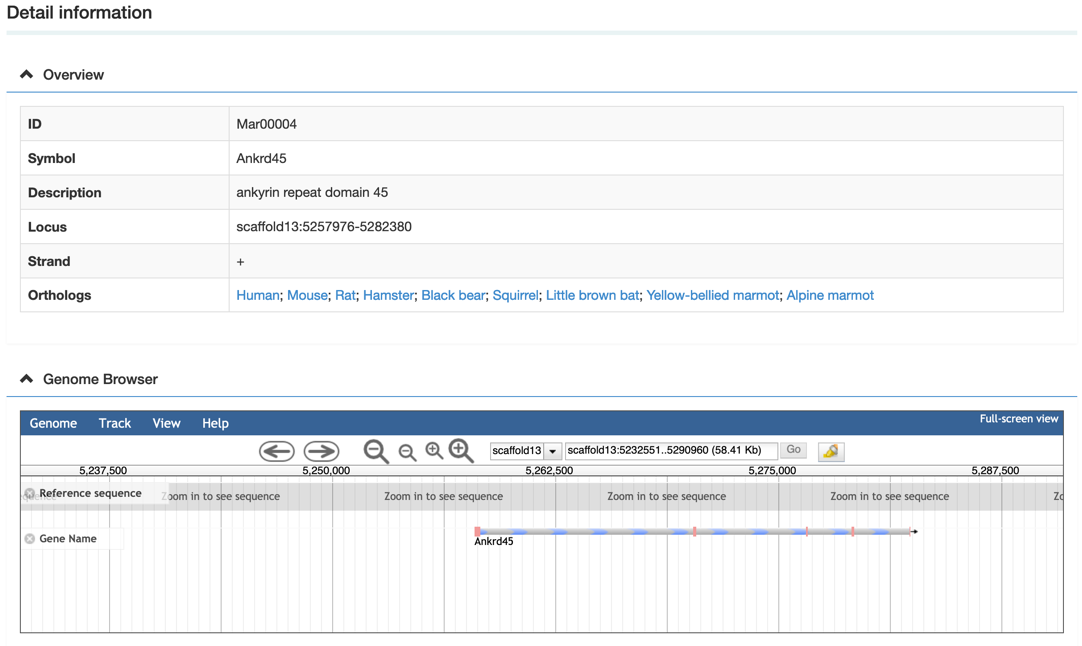
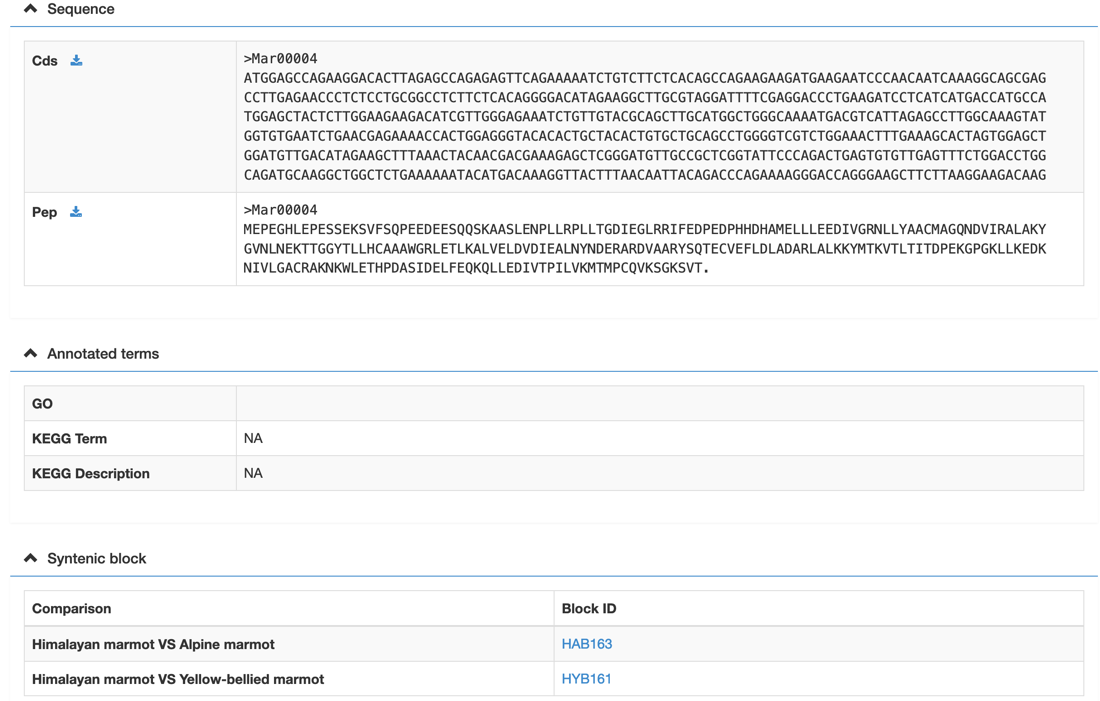
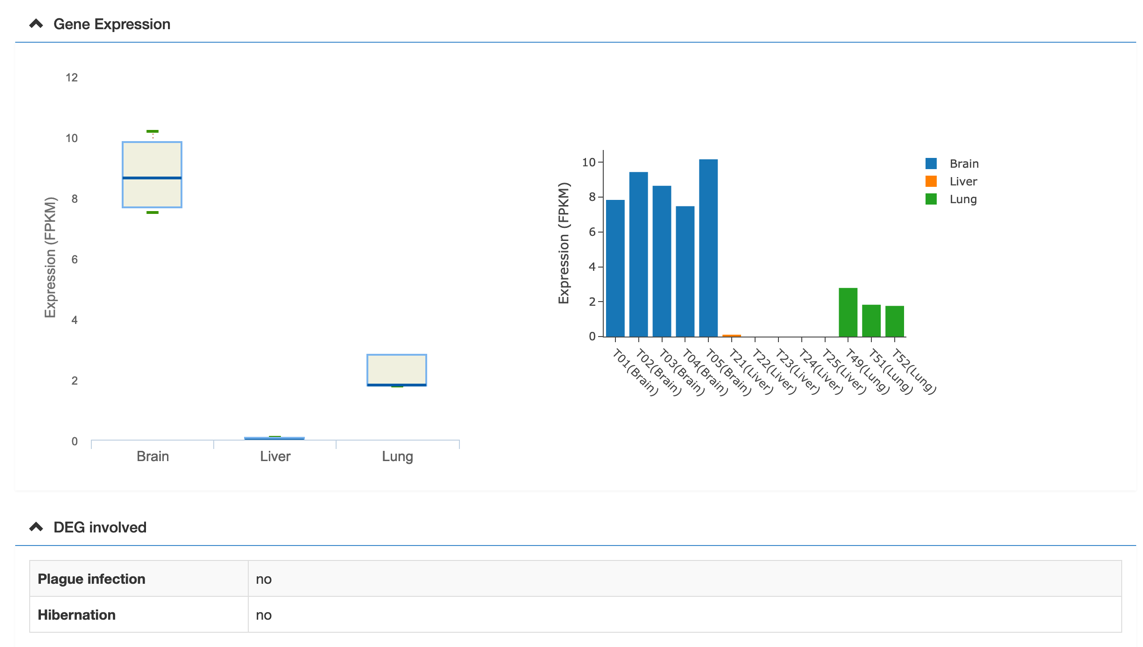
 Step 3: View the gene information
In the gene detail information page, users would view the gene basic information, functional classification, tissue-specific expression, syntenic blocks, a graphic gene structure, etc. Meanwhile, the graphic gene structure and synteny blocks are linked to the genome browse and synteny block page, respectively.
 C. Function classification retrieval
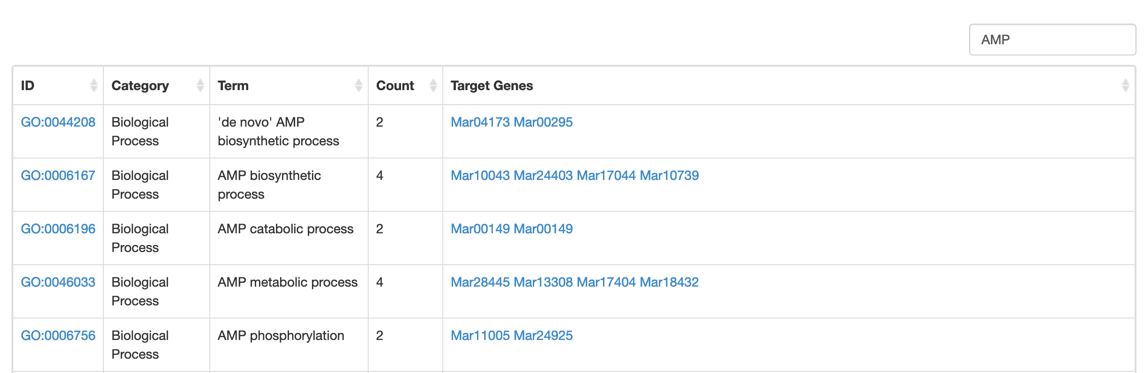
Uses would browse genes by GO term, KEGG pathway.
Step1: Select the marmot species and KEGG/GO term.
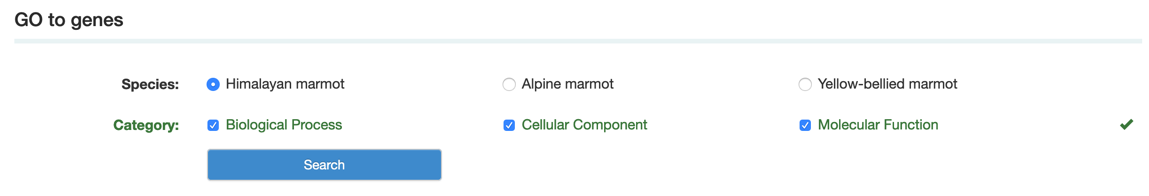 Step2: Type the keyword to search the KEGG/GO terms or select the GO/KEGG term that you want.
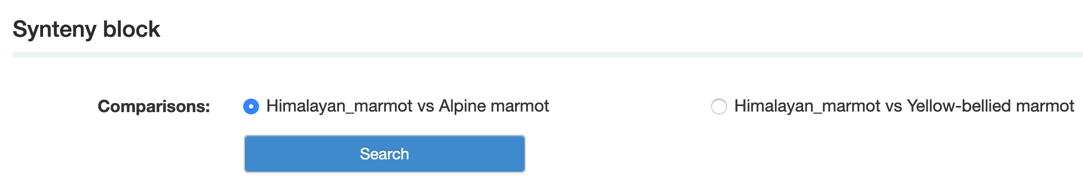
 By using Browse, database user could also view the synteny blocks between Himalayan marmot and other two marmots: Alpine marmot and Yellow-bellied marmot.
Step1: Select the comparison that you want.
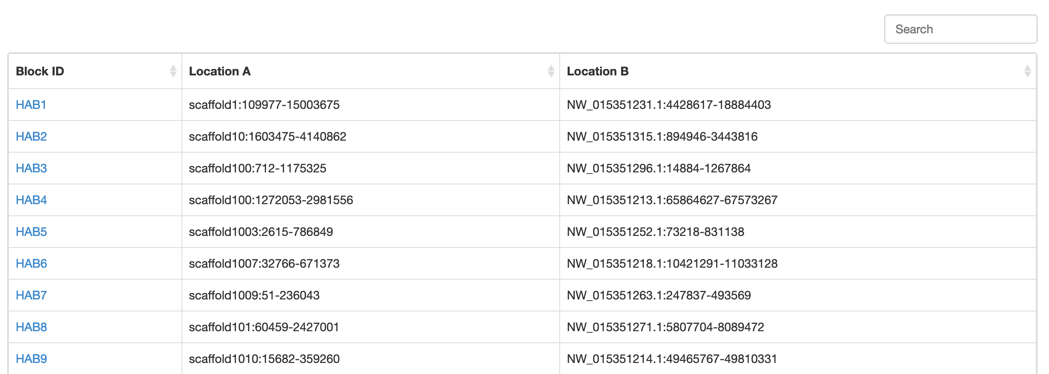
 Step2: Select the synteny block that you want.
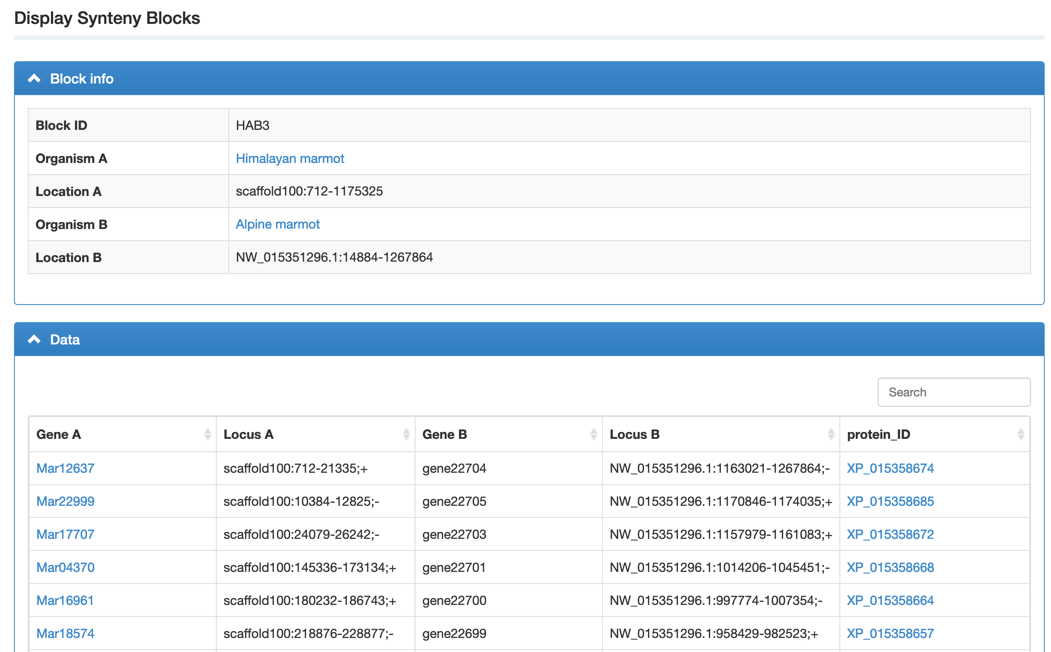
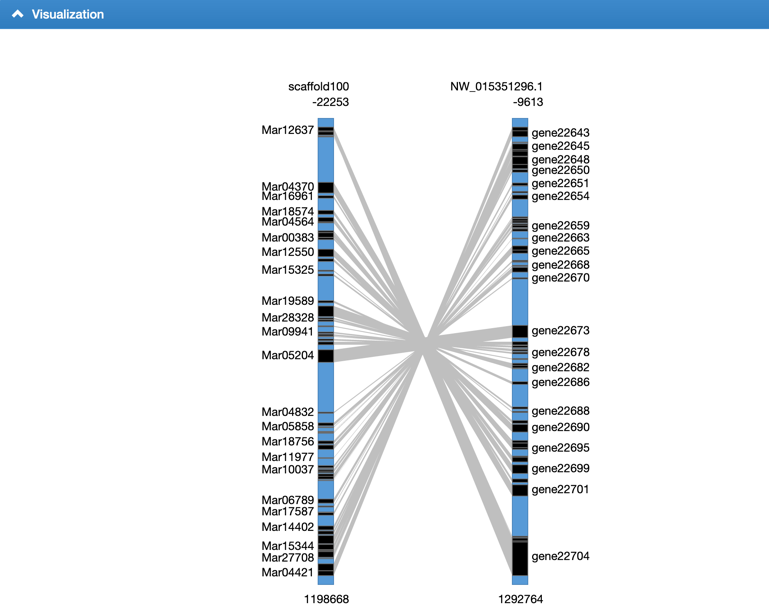
 Step3: View the block information. We integrated a visualized synteny block to show the gene syntenic relationship.
2. How to use the genome browser
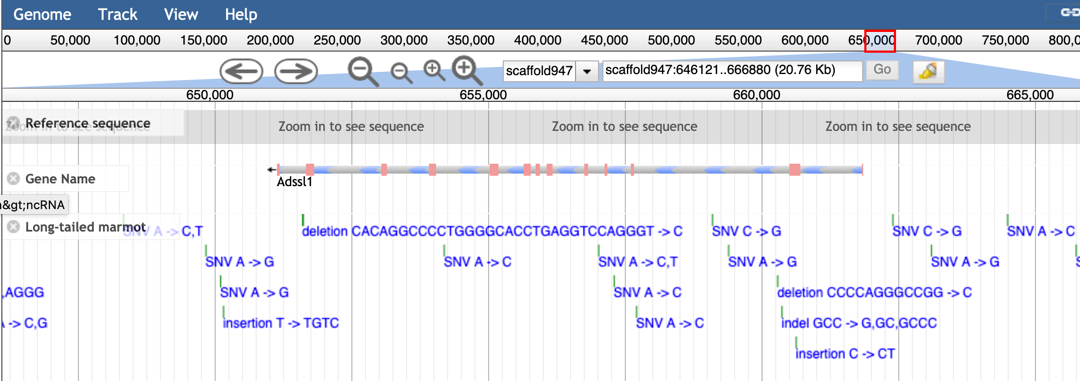
JBrowse is a popular genome browser for displaying annotations on genomes by combining the database and interactive web pages. By JBrowse, the users could view the gene structures of three marmots and genomic variations of another five marmots. In addition, we built a combination between JBrowse and gene retrieval system.
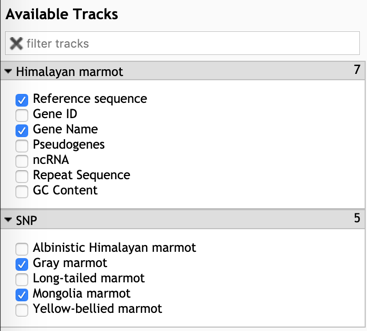
Step1: Select the tracks that you want to display.
Step2: Type the gene ID or scaffold region to view the gene model and the genomic variations within this gene in other marmots.
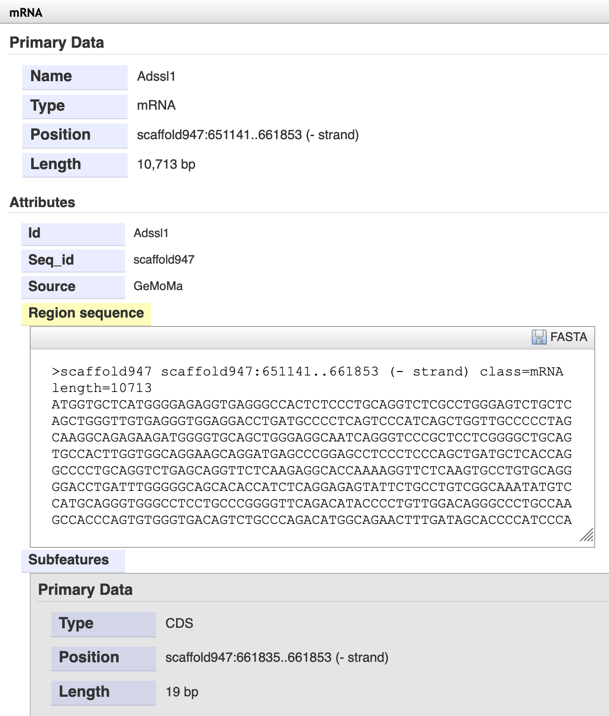
 Step3: Click the gene ID and view the gene basic information and sequence.
3. How to use the online tools
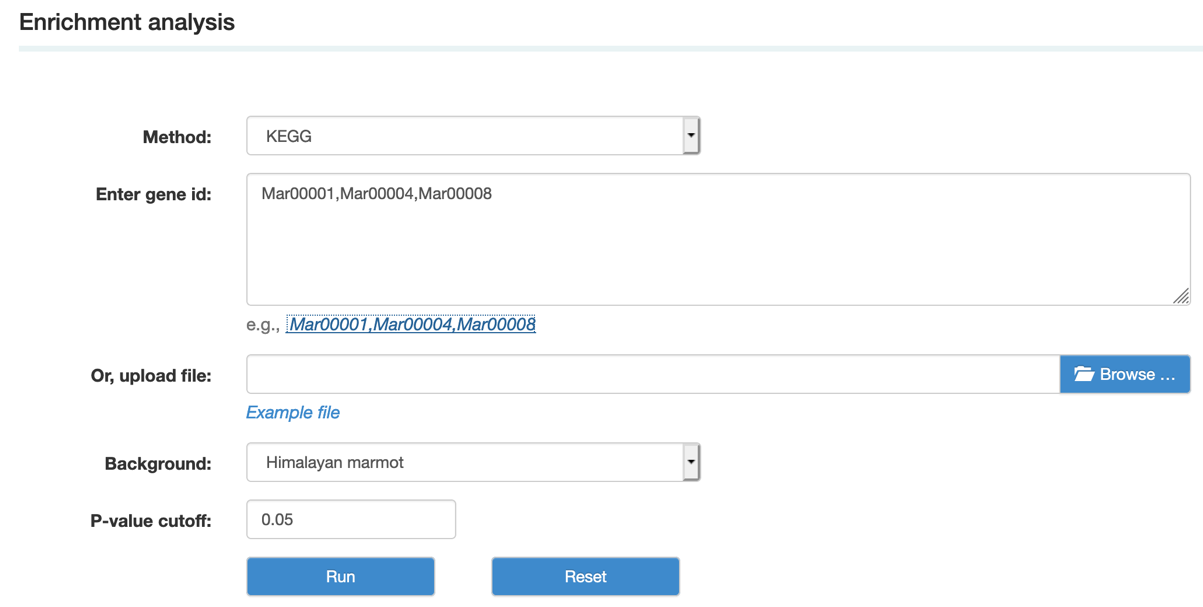
A. Enrichment analysis pipeline. By using the enrichment analysis pipeline, we are able to identify significantly enriched GO/KEGG terms among the given list of genes using accurate statistical methods.
Step1: Select the method and background species, paste or upload gene IDs, and set the P-value cutoff.
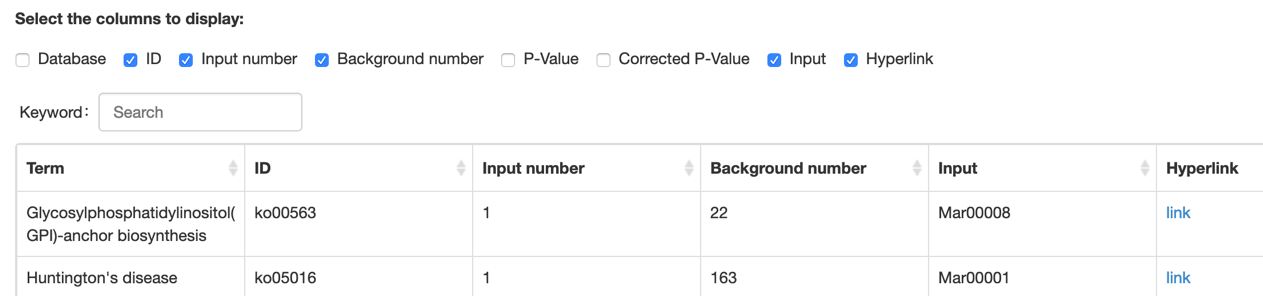
 Step2: Choose the items that you want to show and view the results.
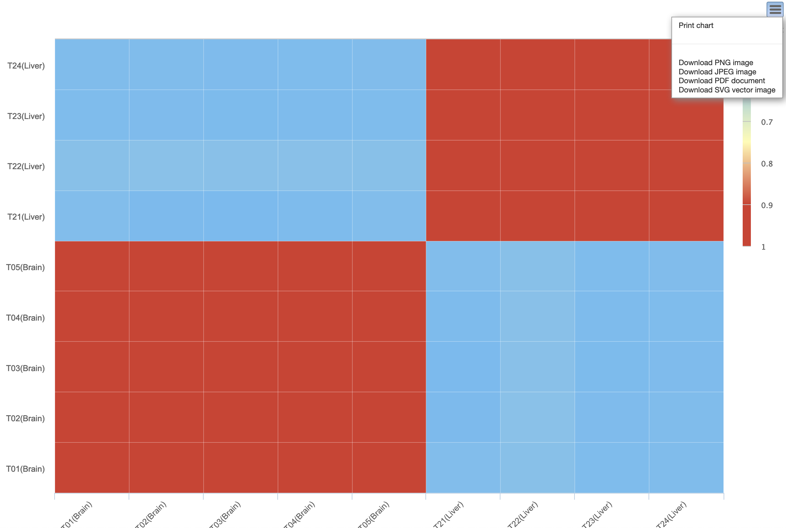
B. Correlation heatmap uses colored cells, typically in a monochromatic scale, to show a 2D correlation matrix between two discrete dimensions or event types. This enables the users to quickly identify incidence patterns, and to recognize anomalies.
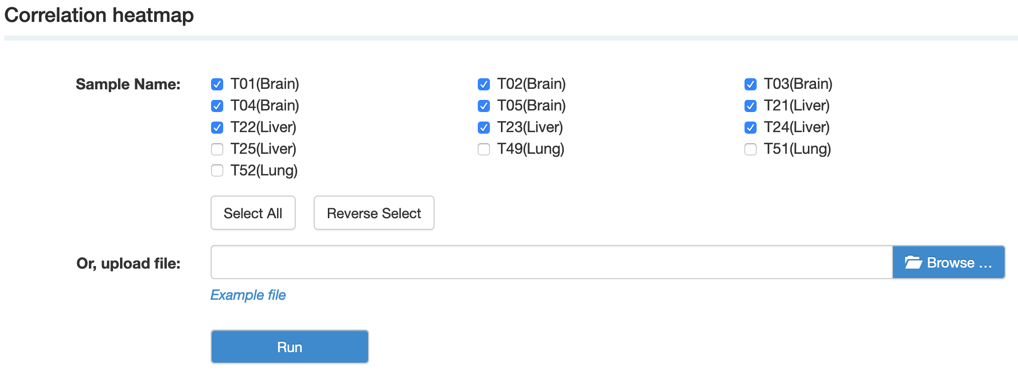
Step1: Select the sample name or upload data as the example file
 Step2: View and download the analysis result.
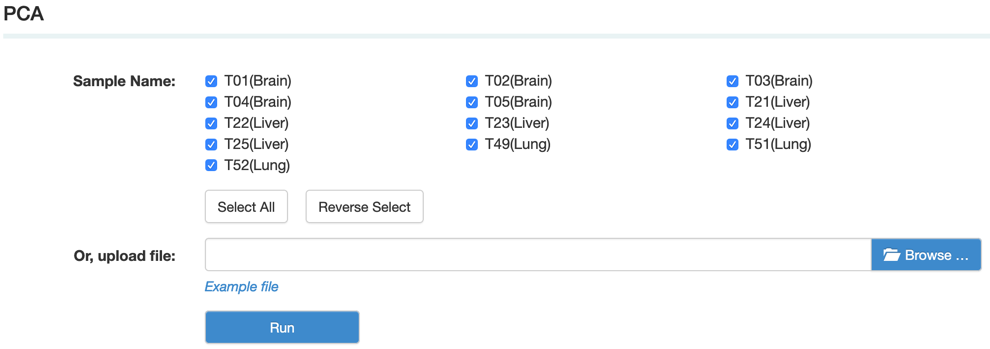
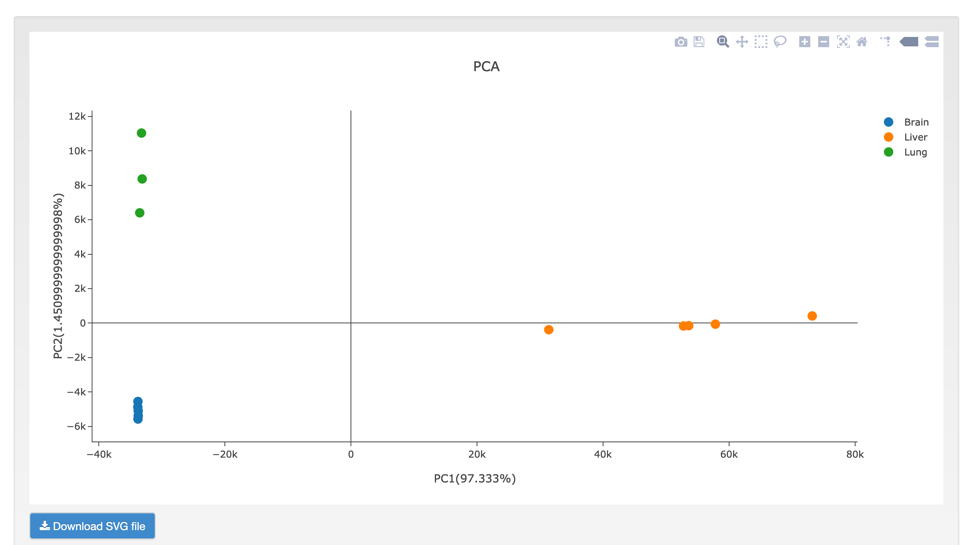
C. PCA (Principal component analysis) is a statistical procedure that uses an orthogonal transformation to convert a set of observations of possibly correlated variables into a set of values of linearly uncorrelated variables.
Step1: Select the sample name or upload data as the example file
 Step2: View and download the result that you want
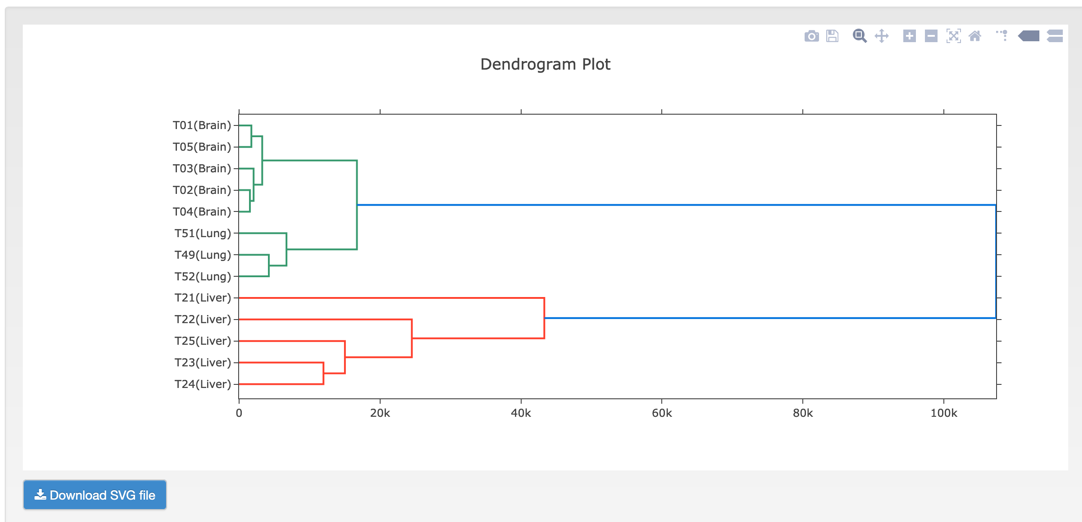
D. HCluster (Hierarchical Cluster analysis) is an algorithm that groups similar objects into groups called clusters. The endpoint is a set of clusters, where each cluster is distinct from each other cluster, and the objects within each cluster are broadly similar to each other.
Step1: Select the sample name or upload data as the example file
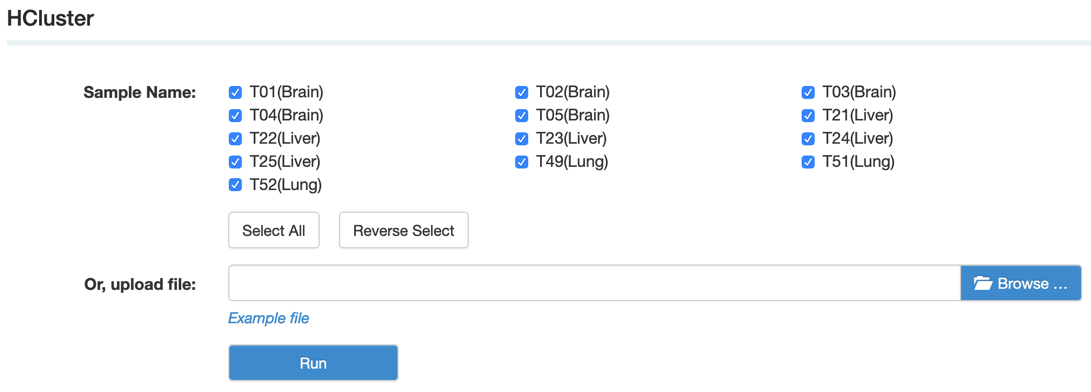 Step2: View and download the result that you want
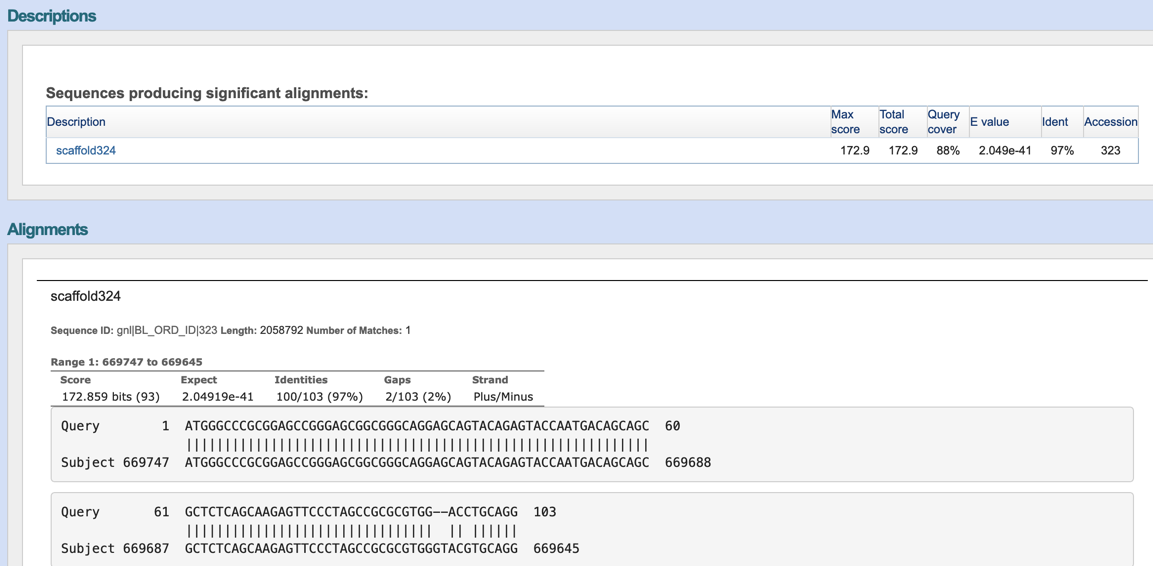
E. Blast
Blast (Basic local alignment search tool) finds regions of local similarity between sequences (Altschul et al. 1997). The program compares nucleotide or protein sequences to sequence databases and calculates the statistical significance of the matches. BLAST can be used to infer functional and evolutionary relationships between sequences as well as to help identify members of gene families.
Step1: Select the program and database, paste or upload sequences, then set up the parameters.
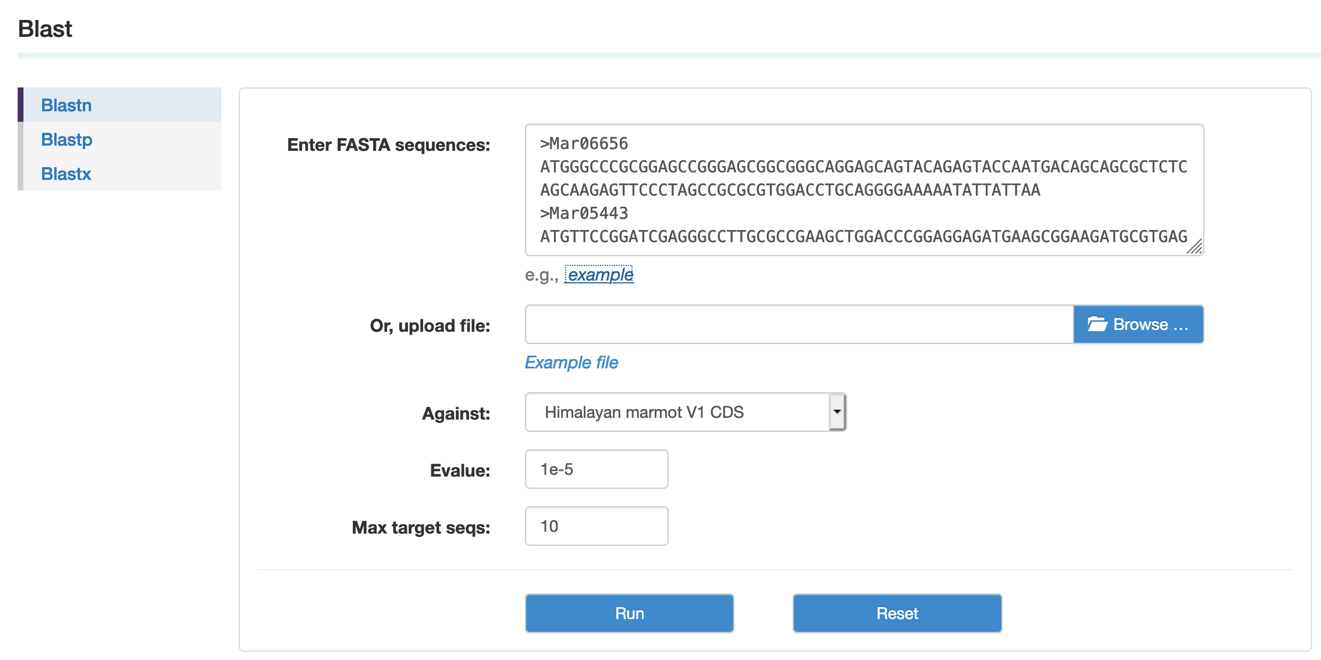 Step2: View the blast results.
F. Muscle
Muscle (Multiple sequence comparison by log-expectation), an accurate multiple sequence alignment tool, especially good with proteins, is claimed to achieve better average accuracy and better speed than ClustalW or T-Coffee, depending on the options (Edgar 2004).
Step1: Paste or upload the sequences in fasta format as example file and select the output format
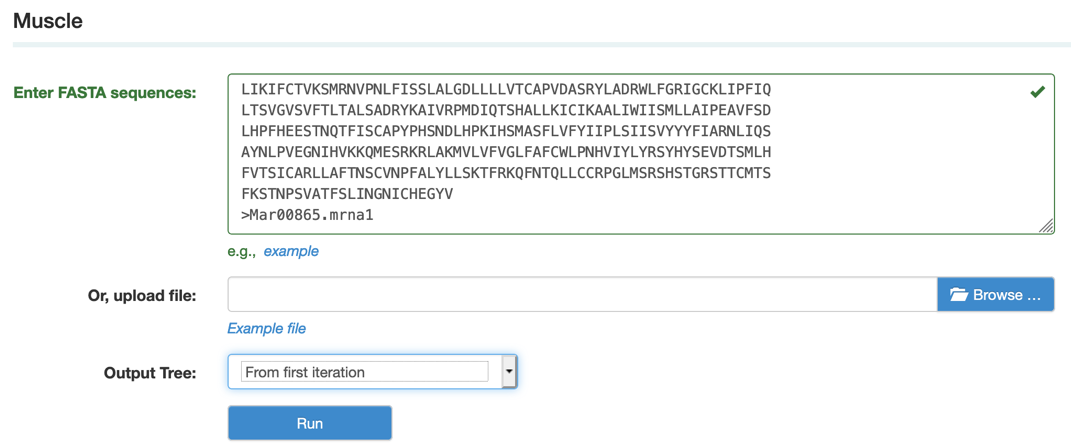 Step2: View and download the result that you want.
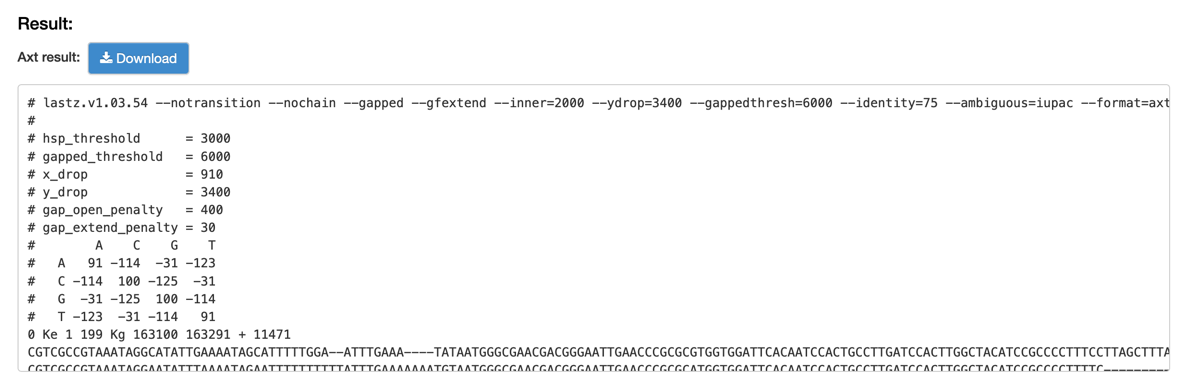
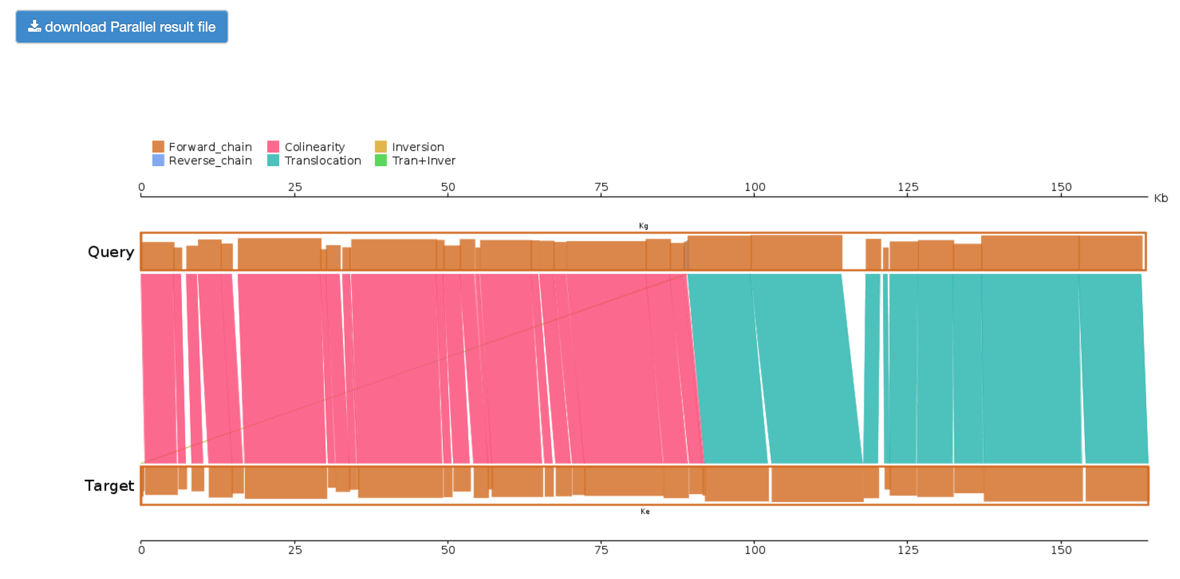
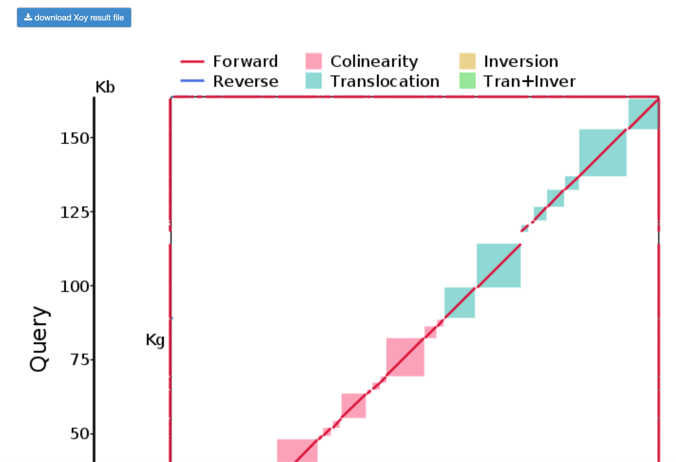
G. Lastz
Lastz (Large-scale genome alignment tool) is a fast and powerful alignment tool for the pairwise alignment of genomic DNA sequence. LASTZ was designed with large-scale genomic analysis and can efficiently align chromosomal or genomic sequences millions of nucleotides in length. It identifies orthologous regions between genomic sequences on a massive scale using a methodology that ignores the coding-region bias.
Step1: Paste or upload the target and query sequences in fasta format as example file
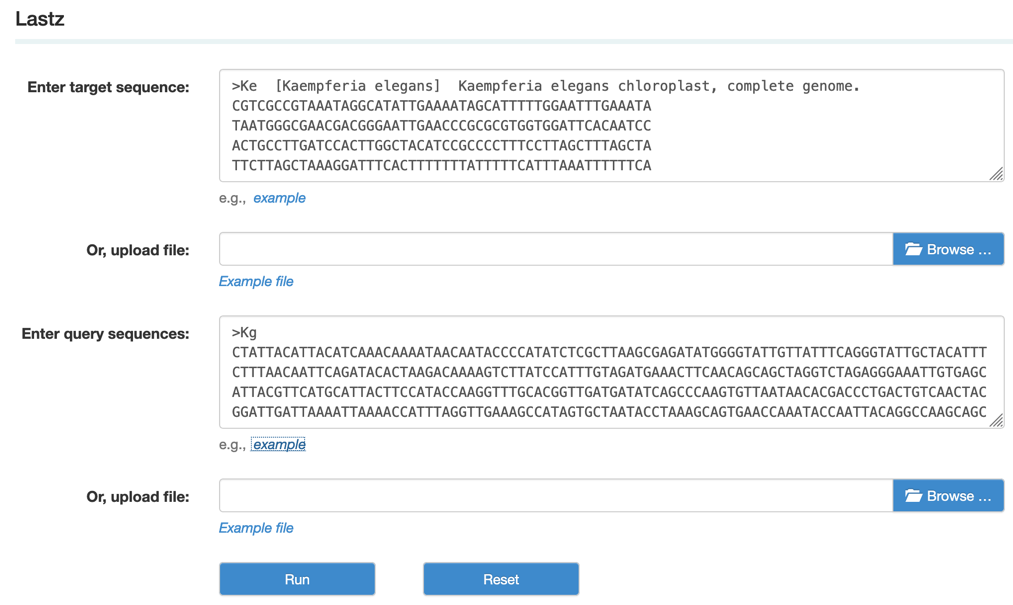 Step2: View and download the Lastz results.
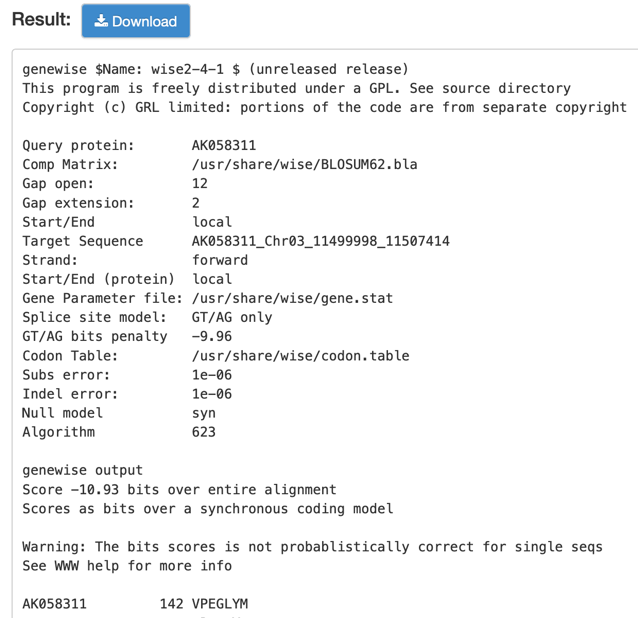
H. GeneWise
GeneWise is a Pairwise Sequence Alignment tool and compares a protein sequence to a genomic DNA sequence, allowing for introns and frames-shifting error. It provides highly accurate and sensitive predictions of gene structures.
Step1: Paste or upload the protein and corresponding genomic DNA sequences in fasta format as the example.
Step2: Set up the parameters
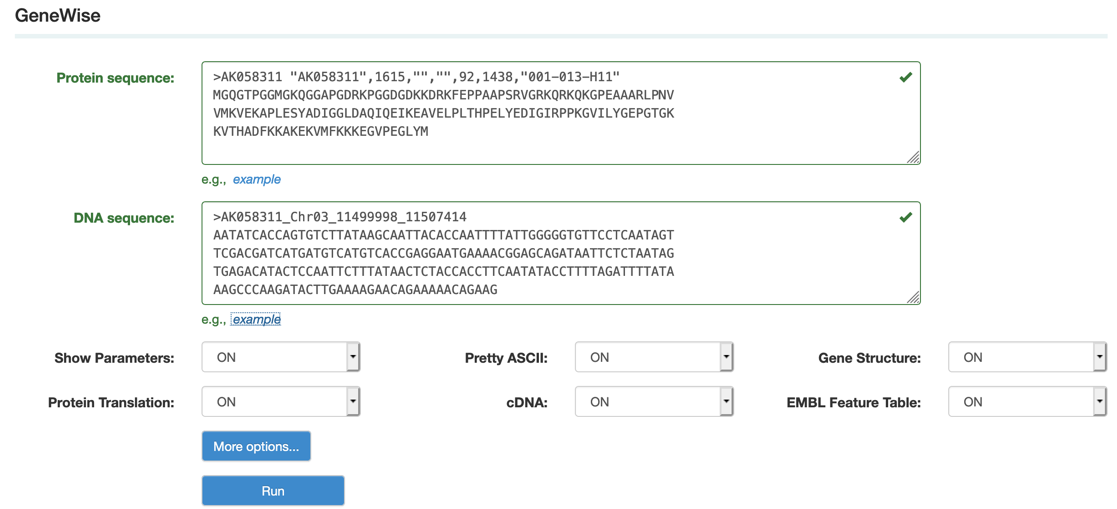 Step3: View and download the result
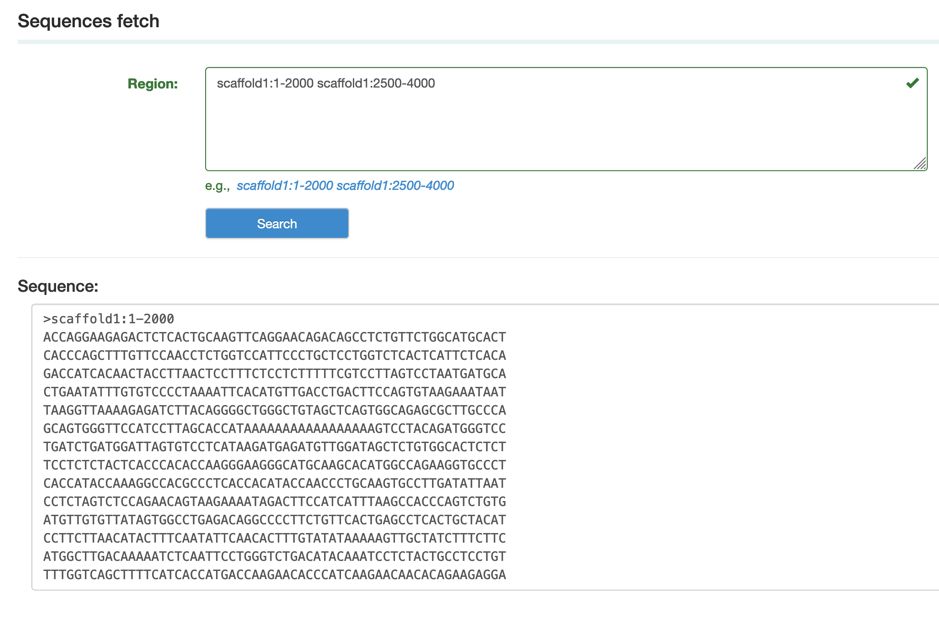
I. Sequences fetch
Sequences fetch can extract the sequence from Himalayan marmot genome by scaffold locus.
Step1: Type the scaffold region and then copy the corresponding sequence.